Macroeconomic Instability IndeX (MIX)
Here is a list of several economic reports that are favorites of economy watchers:
- Business Inventories–
- Consumer Price Index–
- Housing Market Index–
- Housing Starts–
- Import and Export Prices–
- Industrial Production–
- Jobless Claims–
- Manufacturing Survey–
- Mortgage Application Survey–
- NFIB Small Business Optimism Index–
- Philadelphia Fed Business Outlook Survey–
- PPI-Fed–
- Retail Sales Report–
- Treasury Department International Capital–
![]() All are excellent information. But, taken together, these and numerous other reports did not help predict the Great Recession or the contemporaneous financial market losses that occasioned the collapse. These leading indicators are excellent in determining rates of growth derived form straightened prior projections after the shock and once things have bottomed out and turned around. It is an entirely different matter determining whether there is underlying systemic instability happening all the while that encouraging growth is being reported as the economy is about to flip. Indeed, there was good economic growth happening when it ended with a world-wide bang from the popping of the financial and mortgage market bubbles. Most of the professionals, not even Ben Bernanke and Janet Yellen, watching all these reports for instability prior to the Great Recession got surprised as the economy got shocked and they said, “We did not see this coming.” Read more.
All are excellent information. But, taken together, these and numerous other reports did not help predict the Great Recession or the contemporaneous financial market losses that occasioned the collapse. These leading indicators are excellent in determining rates of growth derived form straightened prior projections after the shock and once things have bottomed out and turned around. It is an entirely different matter determining whether there is underlying systemic instability happening all the while that encouraging growth is being reported as the economy is about to flip. Indeed, there was good economic growth happening when it ended with a world-wide bang from the popping of the financial and mortgage market bubbles. Most of the professionals, not even Ben Bernanke and Janet Yellen, watching all these reports for instability prior to the Great Recession got surprised as the economy got shocked and they said, “We did not see this coming.” Read more.
In American English, one of the often heard idiomatic phrases that best describes the Great Recession mess and its aftermath is, “This is no way to run a railroad.” To run a railroad well, it is all about timing, flow rates and especially stable infrastructure. Using that image, in the real world, it is more important to know whether you are going off the rails than to know how fast (rate) you are traveling on the rails. Stability precedes confident growth. Heretofore, most economists have been fixated on various rates, like, real or nominal growth rates or inflation rates or unemployment rates. This is one-dimensional observation.
 Macroeconomic Review has added an additional economic dimension for review—the more important dimension: stability. With it, there are now at least four boxes (quadrants) to consider when trying to understand the macroeconomy. Stability and instability are mapped with stagnation and growth. Check out the quadrants.
| II -Stability with Stagnation | IV -Stability with Growth |
| I -Instability with Stagnation | III -Instability with Growth |
It is an oxymoron to define Quadrant IV as stable growth because growth is actually not stable. What is needed is enough stability, within ranges, to accommodate growth and not foster possible stagnation. Clearly, after the Dot-Com Bomb and its associated recession, after quadrant II, the U.S. economy was in Quadrant IV for a short while before falling back into illusionary Quadrant III (unstable growth) for several years before the Great Recession hit—before it went running off the rails into Quadrants I—the Great Recession. After the wreck, it took some time for the flat economy to stabilize into Quadrant II before moving today into the early signs of a Quadrant IV revival. Note how the business cycle, defined by Macroeconomics Review, is mostly a clockwise movement through the four quadrants. This movement is key. The macroeconomy is always on its way into or coming out of one of the quadrants. In short, from all the historic data, Macroeconomics Review has conclude that there is no such thing as market equilibrium or economic equilibrium. It is all about measuring tolerable disequilibrium within all the systems with their risk generating flows and quadrant movements.
 Macroeconomics Review has developed a reliable and proprietary way to anticipate and predict periods of prosperity and recession using systemic instability measures of the macroeconomy. In addition to providing quadrant status, for Premium Member subscribers of Macroeconomic Review, a handy measure is provided, among other tools, to account for instability and risks in the economy. It is called the Macroeconomic Instability IndeX (MIX). Using plus and minus scores around a mean of zero, the MIX number is a standardized measure of current instability tracking or passing through an aggregate long-term moving instability average in-turn passing through the quadrants. When current aggregate instability accounting crosses too far above zero; things are then ripe for the train to go off the tracks. This index and its underlying composite indices have predicted every period of prosperity and recession since 1979. For Premium Members, the entire chart is always shown from 1979 to the most current data—nothing is held back. It is all in the MIX.
The macroeconomy is viewed by Macroeconomics Review as a machine prone to instability. Using standard deviation jargon, the current MIX index is reported as being deviated above or below the standardized zero-score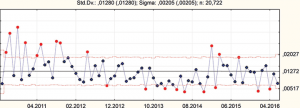 . The MIX Chart is very similar to a manufacturing dynamic control chart illustrated to the left. Using a central “green” safe zone, “yellow” caution zone and an outer “red” dangerous gradient, if the current macroeconomic instability is accounted for far above the standard score instability, these economic flows are dangerous indicating greater economic risk and market risk. The economy tips over. If below the central standard MIX number, the economy is more resilient to derailment–but very vulnerable to inflation; if to far negative it is vulnerable to slow growth and stagnation. The Macroeconomy needs to stay in the green zones of acceptable instability for maximum prosperity.
Others see things differently. Alternatively, it has been said by the Fed that the economy is heating up if inflation is above a perimeter set by the FED. This is a price point not a flow. It is more important to know the ultimate flow of inflated dollars and their concomitant instability. The MIX number includes such flows. MIX is not currently provided to the FED. That is reserved for Premium Members. Click on SERVICES & PRICING to get qualified. Become a member with user name and password. Then click PREMIUM MEMBER and login for more proprietary and prescient information.
-J.W.Carlson, Editor-in-Chief
© 2017, J.W.Carlson